Getting started
Quick start
Cashflower is an open-source Python framework for actuarial cash flow models.
Prerequisites
To use cashflower, you need Python version >=3.9.
Installation
Cashflower is available on python Package Index (PyPI). You can install it with the pip tool.
pip install cashflower
Create model
Start your project with creating a new model. You can create multiple models for each product that you work on.
Pass on the name when creating the model, e.g. my_model.
from cashflower import create_model

create_model("my_model")
The create_model() function creates an initial structure of the model.
.
├── input.py
├── model.py
├── run.py
└── settings.py
The initial structure consists of the input.py, model.py, run.py and settings.py scripts.
Input
In the input.py script, you can define runplan, model point sets and other assumptions.
 import pandas as pd

 from cashflower import ModelPointSet, Runplan

 policy = ModelPointSet(data=pd.read_csv("C:/my_data/policy.csv"))

 runplan = Runplan(data=pd.DataFrame({
     "version": [1],
     "valuation_year": [2022],
     "valuation_month": [12]
 }))

 assumption = {
     "interest_rates": pd.read_csv("C:/my_data/interest_rates.csv"),
     "mortality": pd.read_csv("C:/my_data/mortality.csv", index_col="age")
 }
Model point set bases on the ModelPointSet class and runplan bases on the Runplan class.
Model
The model.py script contains the logic of the model. You can define model variables there.
 from input import policy, assumption
 from cashflower import variable

 @variable()
 def age(t):
     if t == 0:
         return int(policy.get("AGE"))
     elif t % 12 == 0:
         return age(t-1) + 1
     else:
         return age(t-1)


 @variable()
 def death_prob(t):
     if age(t) == age(t-1):
         return death_prob(t-1)
     elif age(t) <= 100:
         sex = policy.get("SEX")
         yearly_rate = assumption["mortality"].loc[age(t)][sex]
         monthly_rate = (1 - (1 - yearly_rate)**(1/12))
         return monthly_rate
     else:
         return 1
The variables defined in model.py will be calculated and saved in the output.
Calculate
To calculate the model, run run.py.
cd my_model
python run.py
This command will create the model’s output.
Model overview
Actuarial models help to predict future cash flows of insurance products.
- The main components of an actuarial model are:
model point sets,
assumptions,
runplan,
model variables,
results.
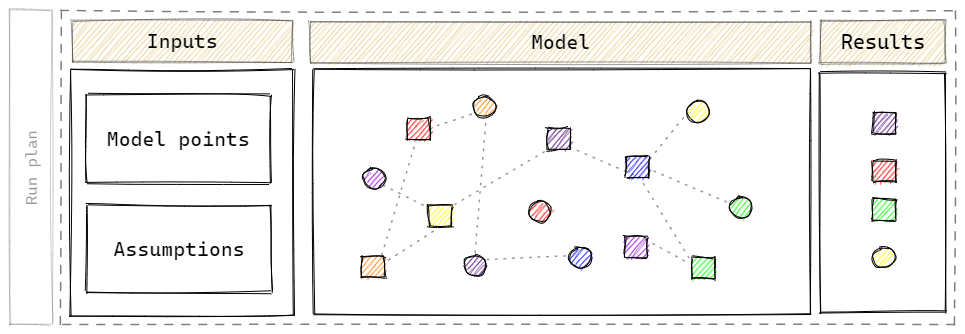
Runplan - runplan is a list of runs that we want to perform with the model.
Model point sets - points of data for which the model is calculated. For example, a model point can contain policyholder’s attributes such as age, sex, premiums, coverage, etc. Model point sets can be split into separate files. For example, there might be separate files for fund and coverage data.
Assumptions - actuarial models are calculated based on assumptions. Examples of underwriting assumptions include mortality, lapses or expenses. Market assumptions are, for example, interest rate curves. Assumptions are also product’s parameters, such as fees or levels of guarantees.
Model - actuarial model reminds a spider’s web. There are many variables which dependent on each other.
Model variables - functions that depend on the projection’s period.
Results - the output of the calculation logic.
Time
Actuarial cash flow models try to predict the future. The results are put on a timeline with future dates.
Time variable t plays an import role. In actuarial reporting, it’s usual to build monthly models.
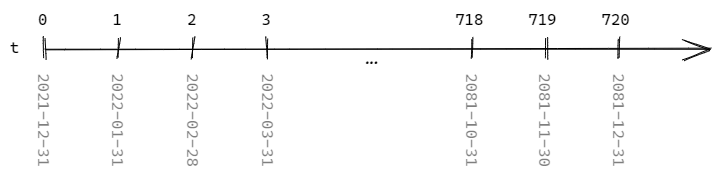
Timeline
Timeline starts at zero (t=0) which is the valuation period.
If the reporting period is the end of year 2021, then t=0 is 2021-12-31.
- The
tvariable reflects certain point in time. If the projections are monthly, then: t=1is 2022-01-31,t=2is 2022-02-28,t=3is 2022-03-31,…
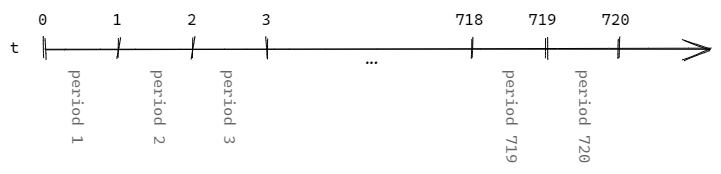
Periods
Some components of the model concern periods rather than points in time.
In these cases, the t variable has a different meaning.
For example, interest rates curve helps to calculate the value of money in time.
If the monthly rate amounts to 0.1% then €100.00 at the end of February is worth €100.10 at the end of March.
The assumption can be presented in the following way:
t |
rate |
|---|---|
… |
… |
3 |
0.001 |
… |
… |
The rate is applied to a third period.
Moment in month
By default, t reflects the end of the month.
If cash flows in different moments of the month, it can be reflected using discounting.
For example, there are premiums occurring in the middle of the month.
Then use if interest rate is i, use (1/(1+i))**(1/2) for discounting.