Settings
The settings of the model are defined in the settings.py script.
The table below summarizes available settings.
Setting |
Possible values |
Default value |
Description |
|---|---|---|---|
GROUP_BY |
a string |
|
The column in the ‘main’ model point set to group aggregated results. |
MULTIPROCESSING |
|
|
Flag indicating whether multiple CPUs should be used for calculations. |
NUM_STOCHASTIC_SCENARIOS |
|
|
The number of stochastic scenarios to be simulated in the model. |
OUTPUT_VARIABLES |
list of strings or |
|
List of variables to be included in the output. If |
SAVE_DIAGNOSTIC |
|
|
Flag indicating whether a diagnostic file should be created. |
SAVE_LOG |
|
|
Flag indicating whether a log file should be created. |
SAVE_OUTPUT |
|
|
Flag indicating whether output file should be created. |
T_MAX_CALCULATION |
integer |
|
The maximal month for calculation. |
T_MAX_OUTPUT |
integer |
|
The maximal month for output file. |
GROUP_BY
The GROUP_BY setting is used to specify the column for grouping the aggregated results.
By default, this setting is configured as None, which means that results are aggregated for all model points without grouping.
When you specify a column from the ‘main’ model point set that defines groups, the results will be grouped based on the values in this attribute.
For instance, if you want to group the results by the product_code, you can set the GROUP_BY
in your configuration file, settings.py, as follows:
settings = {
    # ...
    "GROUP_BY": "product_code",
    # ...
}
Ensure that there is a corresponding column in your model point set, as shown in input.py:
policy = ModelPointSet(data=pd.DataFrame({
    # ...
    "product_code": ["A", "B", "A"]
    # ...
}))
The resulting output will contain aggregated results grouped by the specified column, as demonstrated below:
t    product_code    fund_value
0    A               24000
1    A               24048
2    A               24096.1
3    A               24144.29
0    B               3000
1    B               3006
2    B               3012.01
3    B               3018.03
MULTIPROCESSING
By default, the model is evaluated for each model point one after another in a linear process. If the computer has multiple cores, it’s possible to perform calculations in parallel.
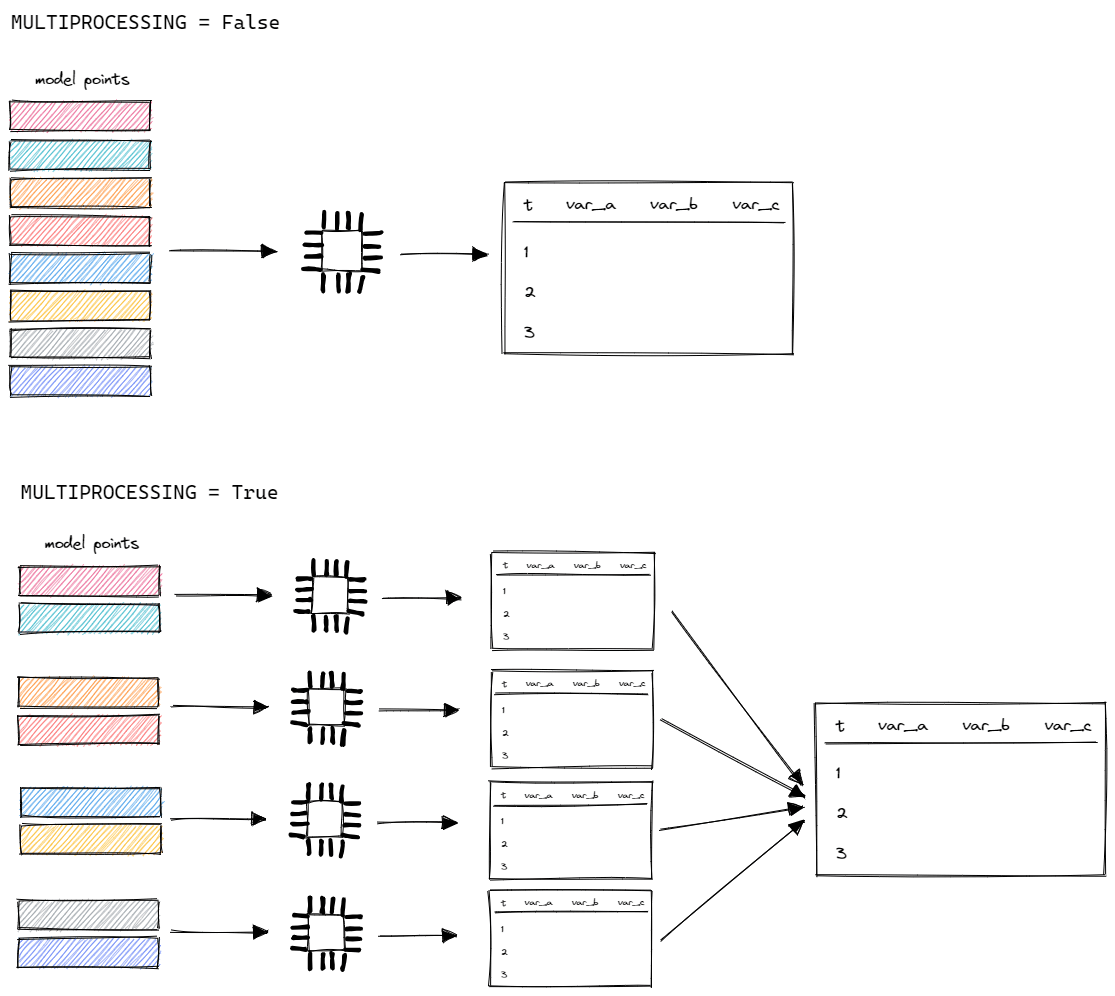
If MULTIPROCESSING is turned on, the model will split all model points into several parts (as many as the number of cores).
It will calculate them in parallel on separate cores and then merge together into a single output.
Thanks to that, the runtime will be decreased. The more cores, the faster calculation.
It is recommended to use MULTIPROCESSING when the model is stable because the log message are more vague.
For the development phase, it is recommended to use single core.
NUM_STOCHASTIC_SCENARIOS
The NUM_STOCHASTIC_SCENARIOS setting defines the number of stochastic scenarios the model will compute.
By default, NUM_STOCHASTIC_SCENARIOS is set to None, meaning the model will perform a single deterministic calculation. If you specify a positive integer, the model will simulate that many scenarios and average the results.
For example, if NUM_STOCHASTIC_SCENARIOS is set to 5, the model will generate five different scenarios for each stochastic variable and calculate the average of these scenarios as the final result. This setting allows for capturing the variability in future outcomes by considering multiple plausible scenarios.
OUTPUT_VARIABLES
By default, the model outputs all variables. If you do not need all of them, provide the list of variables that should be in the output.
The default value of the OUTPUT_VARIABLES setting is None.
All variables are saved in the output.
settings = {
    # ...
    "OUTPUT_VARIABLES": None,
    # ...
}
If the model has 3 variables, all of them will be in the output.
from cashflower import variable

@variable(a)
def a(t):
    return 1*t

@variable(b)
def b(t):
    return 2*t

@variable(c)
def c(t):
    return 3*t
The result contains all variables.
t   a   b   c
0   0   0   0
1   1   2   3
2   2   4   6
3   3   6   9
0   0   0   0
1   1   2   3
2   2   4   6
3   3   6   9
The user can choose a subset of variables.
settings = {
    ...
    "OUTPUT_VARIABLES": ["a", "c"],
    ...
}
Only the chosen variables are in the output.
t   a   c
0   0   0
1   1   3
2   2   6
3   3   9
0   0   0
1   1   3
2   2   6
3   3   9
SAVE_DIAGNOSTIC
The SAVE_DIAGNOSTIC setting is a boolean flag that determines whether the model should save diagnostic information.
By default, the setting is set to False, so the diagnostic file is not created.
When the SAVE_DIAGNOSTIC setting is set to True, the model saves a file named <timestamp>_diagnostic.csv in the output folder:
.
└── output/
    └── <timestamp>_diagnostic.csv
The diagnostic file contains various pieces of information about the model’s variables, such as:
variable   calc_order   cycle   calc_direction   type      runtime
a          1            False   irrelevant       default   5.4
c          2            False   backward         constant  2.7
b          3            False   forward          array     7.1
This file can be valuable for gaining insights into the model’s behavior, identifying variables that require the most processing time, and optimizing them for better performance.
Using the diagnostic file is helpful for understanding and improving the model’s performance.
SAVE_LOG
The SAVE_LOG setting is a boolean flag that controls whether the model should save its log to a file.
By default, the setting is set to False, so the log is not saved.
When SAVE_LOG is set to True, the model will save a file named <timestamp>.log in the output folder:
.
└── output/
    └── <timestamp>.log
The log file contains saved log messages that are printed to the console during the model’s execution. It provides a record of key events and settings, which can be valuable for troubleshooting and tracking the model’s behavior.
Here is an example of the content of the log file (<timestamp>.log):
14:40:08 | Model: 'example'
           Path: C:\Users\john_doe\example
           Timestamp: 20241010_144008
           User: 'johndoe'
           Git commit: 3802041aa00b7a4b4a9fbd9aaaed079add84e0e8

           Run settings:
           - GROUP_BY: None
           - MULTIPROCESSING: False
           - NUM_STOCHASTIC_SCENARIOS: None
           - OUTPUT_VARIABLES: []
           - SAVE_DIAGNOSTIC: True
           - SAVE_LOG: True
           - SAVE_OUTPUT: True
           - T_MAX_CALCULATION: 720
           - T_MAX_OUTPUT: 720

14:40:08 | Reading model components...
           Number of model points: 1534
14:40:08 | Starting calculations...
14:41:12 | Preparing output...
14:41:13 | Finished.
The log file is a valuable resource for understanding the model’s execution flow and can be particularly useful for diagnosing issues or reviewing the model’s behavior at a later time.
SAVE_OUTPUT
The SAVE_OUTPUT setting is a boolean flag that determines whether the model should save its results to a file.
By default, the setting is set to True. When SAVE_OUTPUT is set to True,
the model will save a file named <timestamp>_output.csv in the output folder:
.
└── output/
    └── <timestamp>_output.csv
If you change the SAVE_OUTPUT setting to False, no output file will be created.
You can use this setting to customize output file creation or perform other actions with the results, such as saving them to a database.
To create custom output files, you can utilize the output variable in the run.py script.
if __name__ == "__main__":
    output, _, _ = run(settings)
    output.to_csv(f"results/my_awesome_results.csv")
The output variable contains a data frame with the results. In the example above, it will create a CSV file named
my_awesome_results.csv in the results folder:
.
└── results/
    └── my_awesome_results.csv
You can use this feature to customise the output or process the results as needed.
T_MAX_CALCULATION
The T_MAX_CALCULATION is the maximal period of the calculation.
The model will calculate results for all time periods from 0 to T_MAX_CALCULATION.
By default, the setting is set to 720.
T_MAX_OUTPUT
The T_MAX_OUTPUT is the maximal month in the output file.
By default, the model will save results for 720 periods.
settings = {
    ...
    "T_MAX_OUTPUT": 720,
    ...
}
If the setting gets changed, then the number of rows in the output file will change.
settings = {
    ...
    "T_MAX_OUTPUT": 3,
    ...
}
The file saves only results for the first 3 months.
t   fund_value
0   27000.0
1   27054.0
2   27108.11
3   27162.32
T_MAX_OUTPUT can’t be greater than T_MAX_CALCULATION.
Model will set T_MAX_OUTPUT to min(T_MAX_OUTPUT, T_MAX_CALCULATION).