Output#
The cash flow model generates three types of output files: output, diagnostic, and log.
These files are organized within the output folder, as shown below:
.
└── output/
    └── <timestamp>_diagnostic.csv
    └── <timestamp>_log.txt
    └── <timestamp>_output.csv
The numerical results of the model variables are stored in the <timestamp>_output.csv file. Users can review
and manipulate the results from this file or utilize the output dataframe returned by the run.py script.
Structure#
The output of a cash flow model is presented as a table, where rows represent time periods, and columns represent model variables. The structure of the output depends on the following settings:
AGGREGATE- this flag determines whether the results should be aggregated or not.T_MAX_OUTPUT- specifies the number of projection periods included in the output.OUTPUT_COLUMNS- a list of output columns to be included (by default, all columns are included).
Let’s explore these settings with examples.
Aggregated output#
You can create aggregated output by setting the AGGREGATE option to True, which is the default setting.
settings = {
    ...
    "AGGREGATE": True,
    ...
}

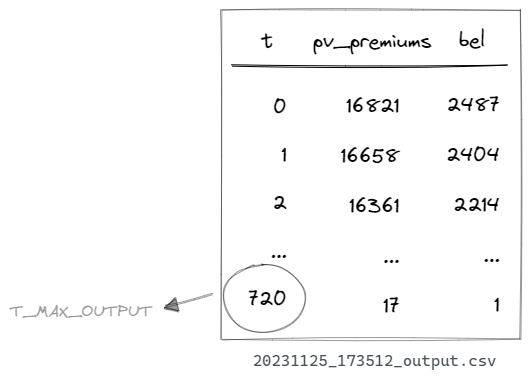
In the aggregated output, results are summed across all model points, resulting in a single set of projections.
The number of rows in this output is determined by T_MAX_OUTPUT + 1, where the +1 accounts for the projection starting at time period 0.
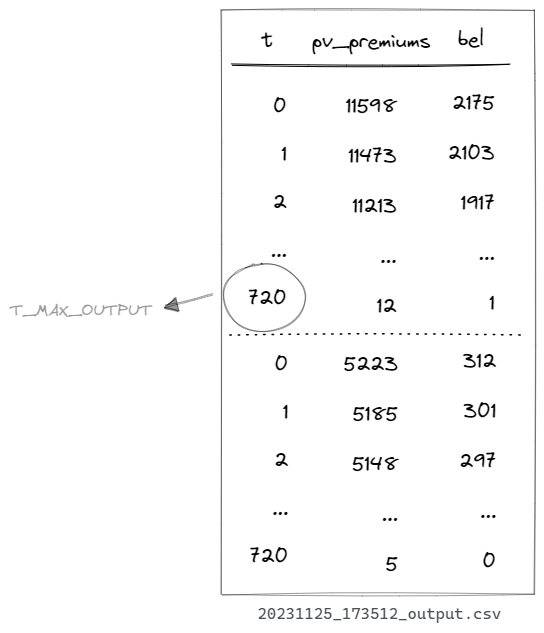
You can also aggregate data by groups. To do this, set the AGGREGATE option to True and specify
the GROUP_BY_COLUMN as the column name containing the grouping variable from your ‘main’ model point set.
For example, to group results by product_code, configure your settings as follows:
settings = {
    ...
    "AGGREGATE": True,
    "GROUP_BY_COLUMN": "product_code",
    ...
}
Individual output#
To generate individual output, set the AGGREGATE option to False.
settings = {
    ...
    "AGGREGATE": False,
    ...
}

In this case, each model point has its own set of results.
Subset of columns#
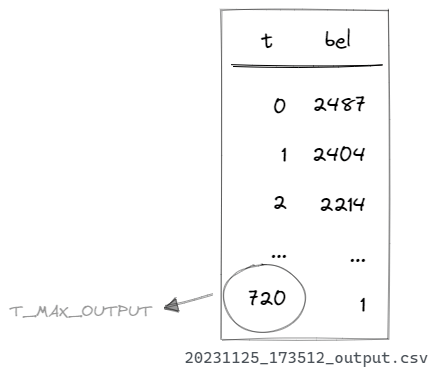
If you only require specific variables in the output, you can select them using the OUTPUT_COLUMNS setting:
settings = {
    ...
    "OUTPUT_COLUMNS": ["bel"],
    ...
}

The OUTPUT_COLUMNS setting takes a list of variables names to include in the output.
By default, when this setting is an empty list, results for all model variables are generated.
Default vs. custom output#
Default output#
By default, the model’s results are saved to a CSV file. This file is saved in the output folder
within the model’s directory. The filename follows the format <timestamp>_output.csv, where <timestamp>
represents the date and time when the model was executed (e.g., 20231125_173512_output.csv).
Custom output#
The default output behavior can be customized to suit specific requirements, such as saving results to different file formats or uploading them to a database. To use custom output, follow these steps:
1. Set the SAVE_OUTPUT setting to False in your settings.py file.
This prevents the model from saving the output in the default manner:
settings = {
    ...
    "SAVE_OUTPUT": False,
    ...
}
2. Modify the run.py script to handle custom output.
For instance, you can save results as a text file without timestamps:
if __name__ == "__main__":
    output = run(settings)
    output.to_string("output.txt")
Now, instead of creating an <timestamp>_output.csv file, the script will generate an output.txt file
with the results.