Graph View
To display the dependency graph of the model, use the --graph flag when running run.py:
terminal
python run.py --graph
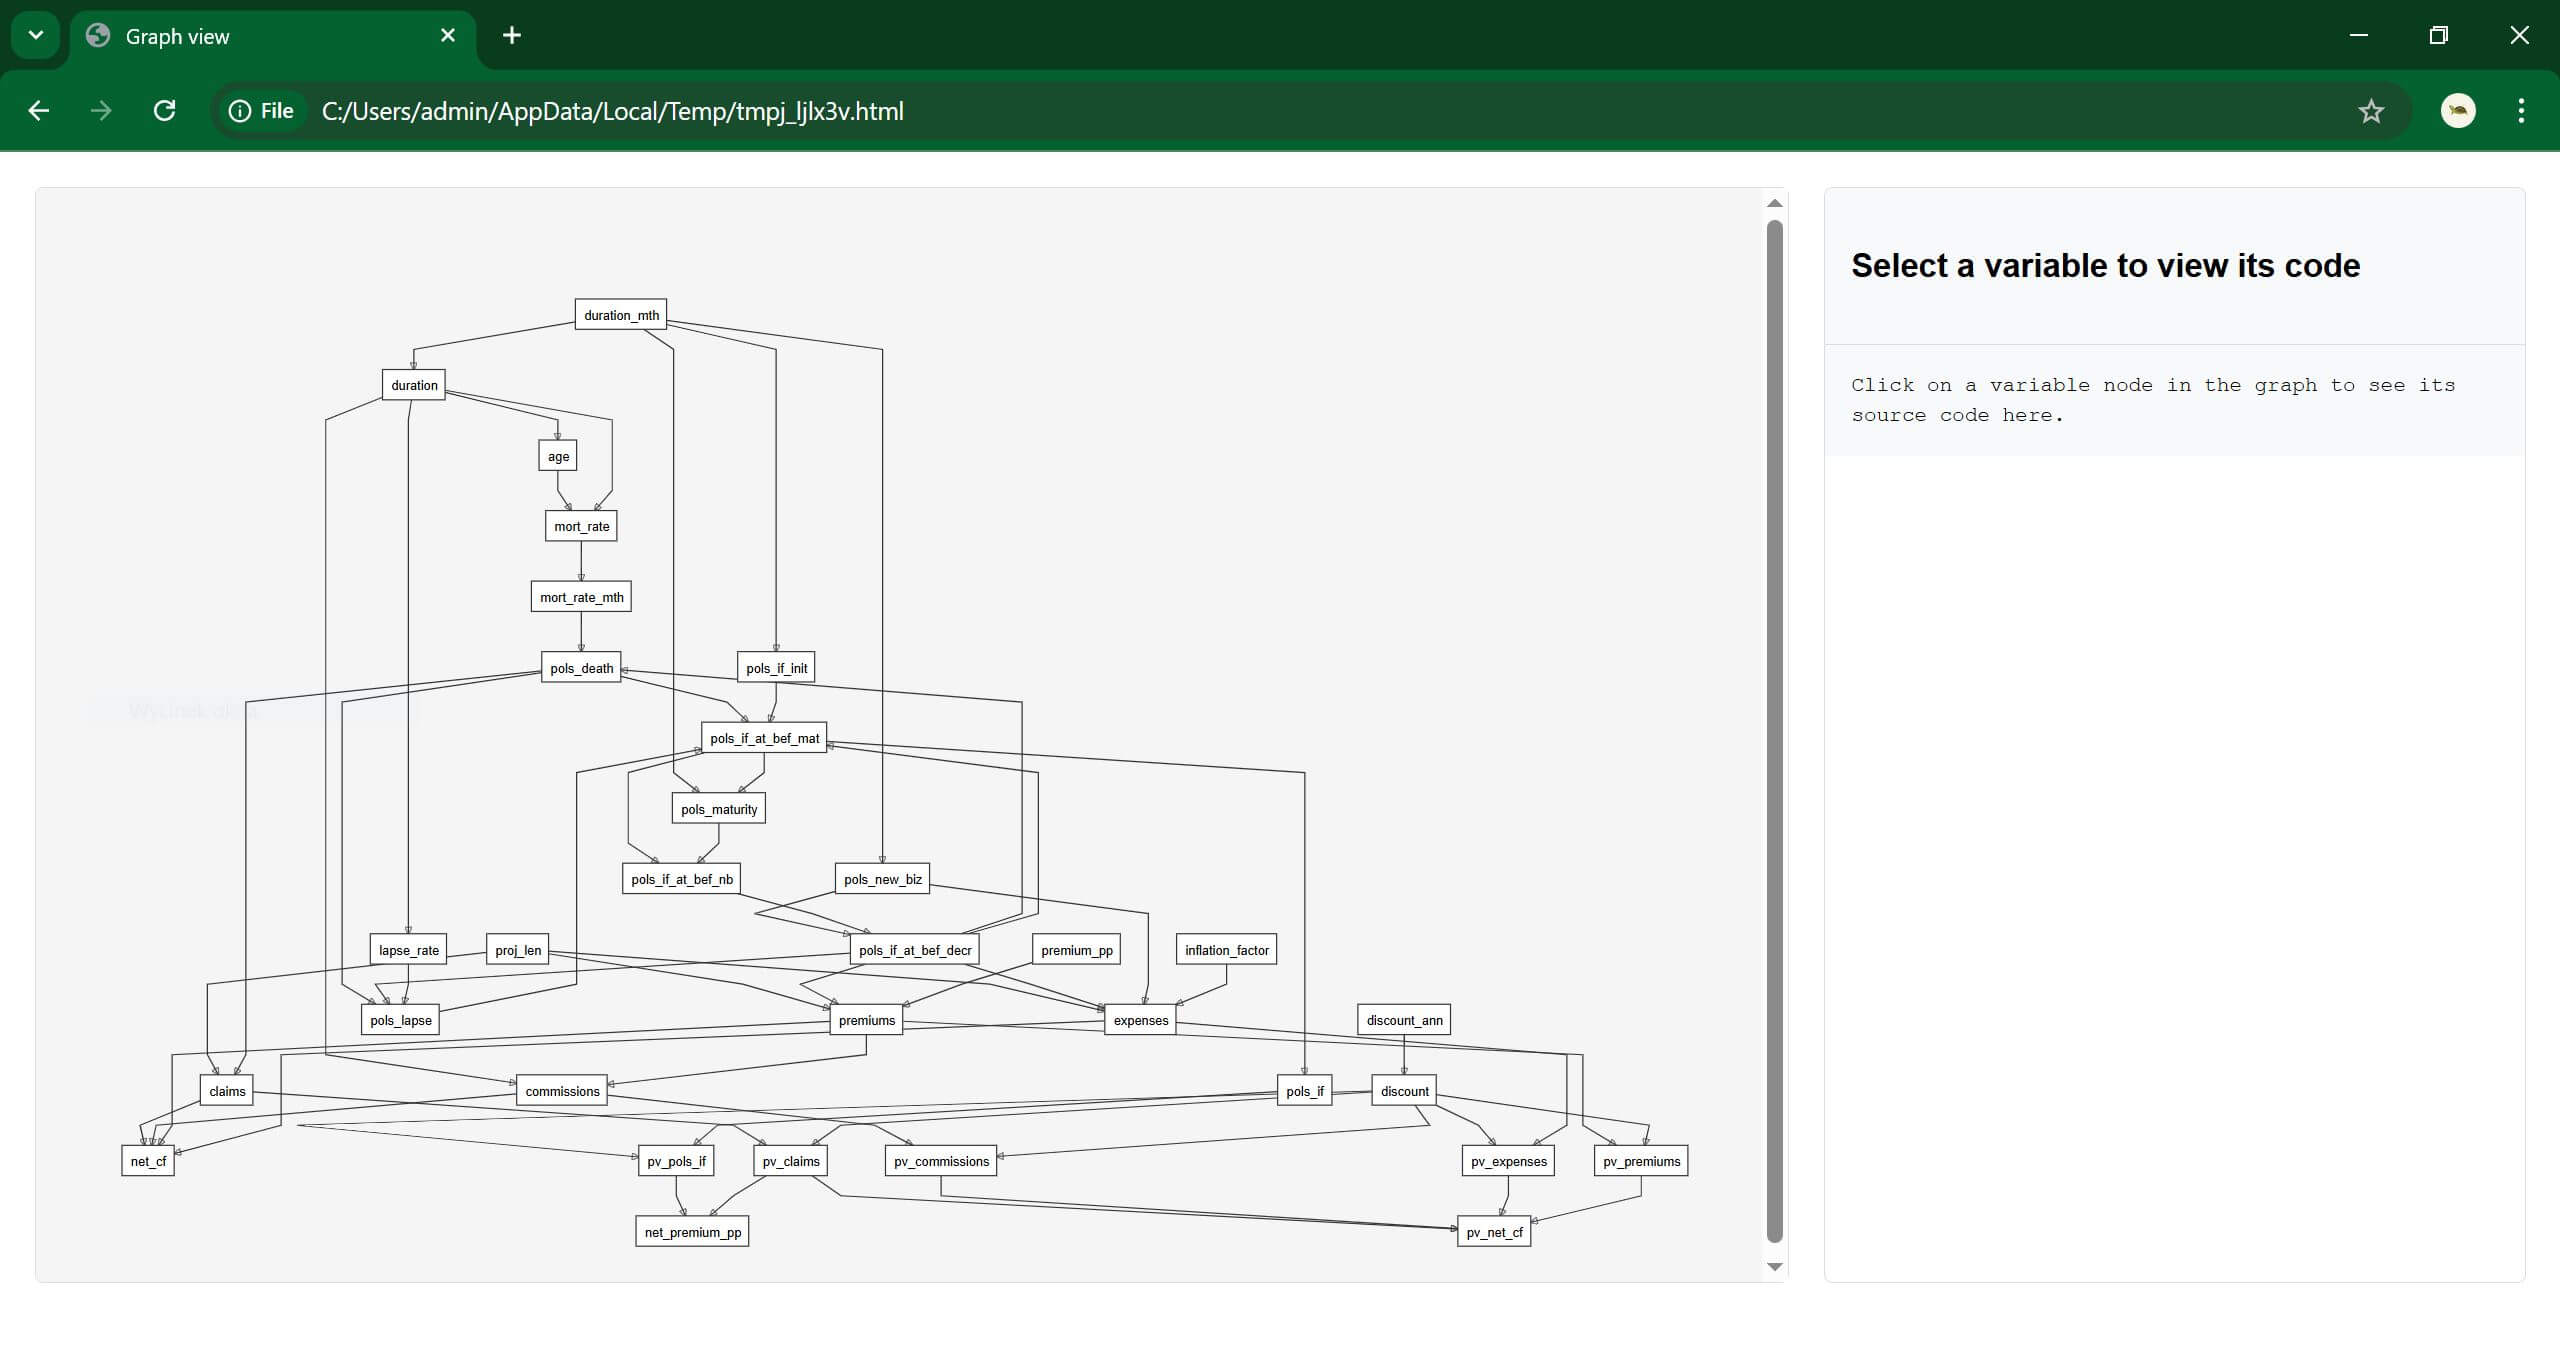
This will open an interactive graph in the default web browser. The graph shows all model variables and their dependencies.
Each node in the graph represents a variable. Arrows indicate the dependency structure. Clicking a node displays the source code of the selected variable.
The Graph View can be used to:
visualize the structure of the model,
explore dependencies between variables,
inspect the code of individual variables.
No calculation is performed when using --graph.